Table of Contents
We all know that first impressions matter, especially when it comes to your website. Fast page loading times and responsive design create a positive user journey and impact your sales. Even improving mobile page speed by half a second can lead to higher conversion and lower bounce rates.
Did you know?
- A study by Akamai found that a delay of just 100 milliseconds in website loading time can lead to a 7% drop in conversion rates.
- A report by HubSpot shows that if a website takes longer than five seconds to load, the bounce rate can increase to as high as 90%.
- Google has stated that page speed is a ranking factor in its algorithm. According to their findings, sites that load faster tend to rank higher in search results.
This trend proves again the load speed should be consistently measured and optimised, so we will explore how to achieve the best result possible.
Why is website speed optimisation important?
Website performance optimisation focuses on improving the technical aspects of your site, helping it to run more efficiently, retain visitors, and boost your brand’s reputation.
Chris Coyier, co-founder of CodePen, notes, “Performance optimisation is not a one-time effort. Continuous monitoring and adjustments are inevitable to ensure your website remains efficient as technology and user expectations evolve“.
Here are the benefits your business gets with the website functioning fast and inch-perfectly.
Improved customer satisfaction
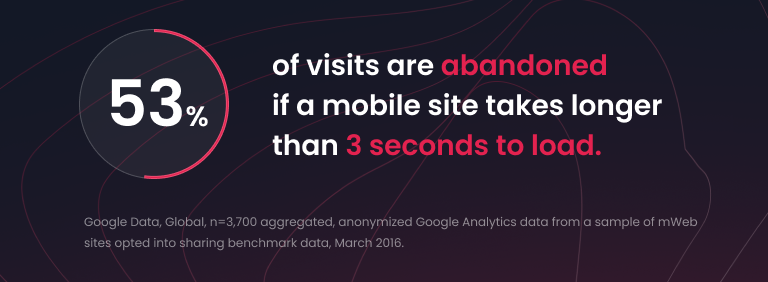
Fast loading speeds and quick response times contribute to a better user experience by allowing visitors to access content without delay, minimising frustration. If users are made to wait, even for less than four seconds, over half will abandon the site.
A fast-loading website improves usability and conveys reliability and professionalism, showing respect for users’ time. To keep load times short and maintain visitor engagement, assess your site’s performance using tools like Google Pagespeed Insights. Thus, you can identify areas for improvement, such as optimising images, improving server response, and enabling browser caching.
Reduced bounce rates
To reduce bounce rates, focus on displaying key content above the fold to immediately capture visitors’ attention and prompt deeper interaction. Also, techniques like lazy loading can improve load times by deferring non-essential elements until needed.
To measure the impact of these optimisations, regularly check bounce rate metrics in Google Analytics before and after making changes and adjust your approach as needed.
Boosted search engine rankings
Search engines like Google rank websites on their results pages based on the quality, relevance, and performance of the content. Higher rankings lead to more visibility, which often results in increased clicks and organic traffic. To assess key metrics such as loading speed and overall performance, tools like Google’s Core Web Vitals report can help identify areas for improvement and guide SEO optimisation efforts.
Increased conversion rates
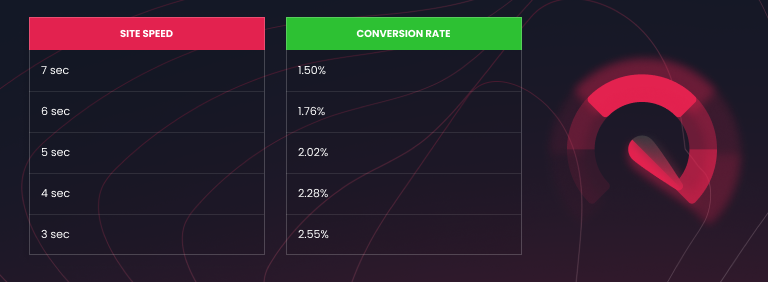
A smooth-running website encourages users to take action – whether making a purchase or filling out a form – by reducing distractions and removing obstacles in navigation. Every second you cut from page load times can lead to a potential 17% increase in conversion rates.
A web performance engineer, Steve Souders argues, “Web performance optimisation is about delivering a better user experience. By focusing on speed and efficiency, you create an environment where users can access content without frustration“.
How to test website performance
The first step in improving a website’s performance is to analyse its current state. Several factors affect the way users perceive a site’s speed and reliability, so measuring site performance testing helps identify the most effective improvements.
You can always use free tools available for this purpose, such as Google Lighthouse (Google Chrome’s DevTools) and Cloudflare Observatory.
These three metrics offer insight into core aspects of web performance.
Largest Contentful Paint
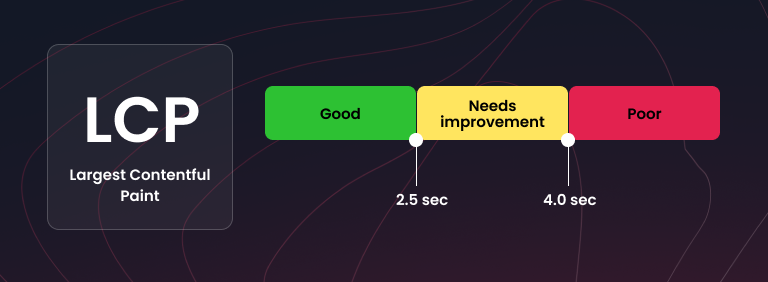
LCP tracks how quickly the largest element on the page loads.
Here are several strategies to improve it:
Optimise images:
- UNext-gen image formats, like WebP or AVIF, were more efficient than JPEG or PNG.
- Compress images without losing quality using tools like TinyPNG or Squoosh.
- Ensure images are responsive, i.e., appropriately sized for different screen resolutions and devices.
Upgrade your hosting:
- Choose a hosting provider with fast response times or upgrade to a Content Delivery Network to serve content faster from geographically distributed servers.
Minimise render-blocking resources:
- Delay or reduce JavaScript and CSS files that block rendering. You can do this by deferring non-critical scripts or using the async and defer attributes for scripts.
Use server-side rendering (SSR):
- For dynamic content-heavy websites, server-side rendering or static site generation can reduce the time it takes for the largest element to render by preloading it on the server.
Optimise CSS:
- Minify CSS files to reduce their size.
- Remove unused CSS to ensure that only necessary styles are loaded.
- Inline critical CSS to allow important styles to load faster.
Preload important resources:
- Use the rel=”preload” attribute in HTML to preload key resources like fonts or large images, ensuring they load as quickly as possible.
Cache assets:
- Implement browser caching to allow returning users to load assets more quickly from local storage.
First Input Delay
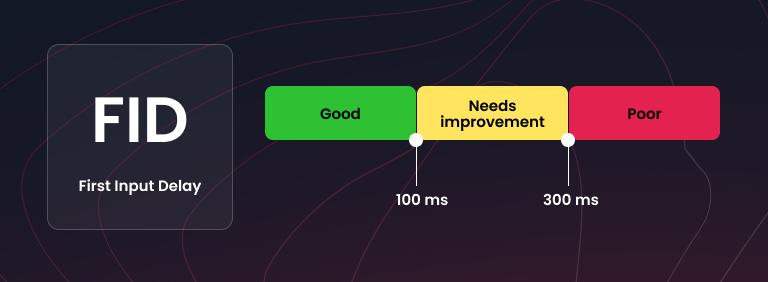
FID measures how fast the page responds to user interactions.
Here are several strategies to reduce FID and enhance website responsiveness:
Optimise third-party scripts:
- Limit the number of third-party scripts such as analytics trackers, ads, or social sharing widgets that can delay interaction. Also, load third-party scripts asynchronously to prevent them from blocking the main thread.
Reduce main thread work:
- Break up large JavaScript files and only load code when it’s needed (code splitting).
- Minimise DOM size and reduce the complexity of your layout (e.g., avoid deeply nested elements).
Implement efficient event listeners:
- Use passive event listeners where possible to improve scrolling performance. These listeners tell the browser that they won’t prevent scrolling, helping reduce input delays.
Optimise fonts:
- Ensure that font loading doesn’t block the rendering of visible content by using techniques like font-display: swap to prevent invisible text while fonts load.
Cumulative Layout Shift
CLS gauges the visual stability of page elements, ensuring content doesn’t unexpectedly shift during loading.
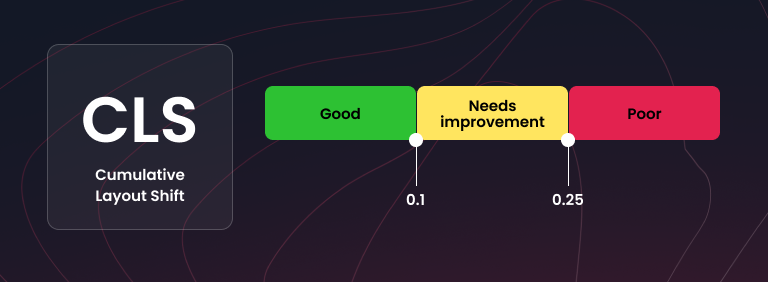
Here's how to improve CLS:
Reserve space for ads and embeds:
- Ads, iframes, or embedded content can cause layout shifts when loaded asynchronously. Allocate space for them in advance to avoid sudden changes in layout. You can use placeholder elements with fixed dimensions.
Use CSS aspect ratio boxes:
- For responsive media like images, videos, and iframes, use CSS aspect ratio boxes (e.g., aspect-ratio property) to maintain the element’s aspect ratio while the content is loading.
Avoid dynamically injecting content above existing content:
- When adding new content (like banners, widgets, or alerts), place it below the current content or reserve space for it from the start. This avoids pushing the page’s layout unexpectedly.
Minimise layout shifts from animations and transitions:
- Use animations that don’t affect layout, such as opacity or transform animations, rather than animations that change the size or position of elements.
In addition to Core Web Vitals, website owners should evaluate other important metrics, such as:
- Time to First Byte (TTFB): Measures how quickly a page starts loading.
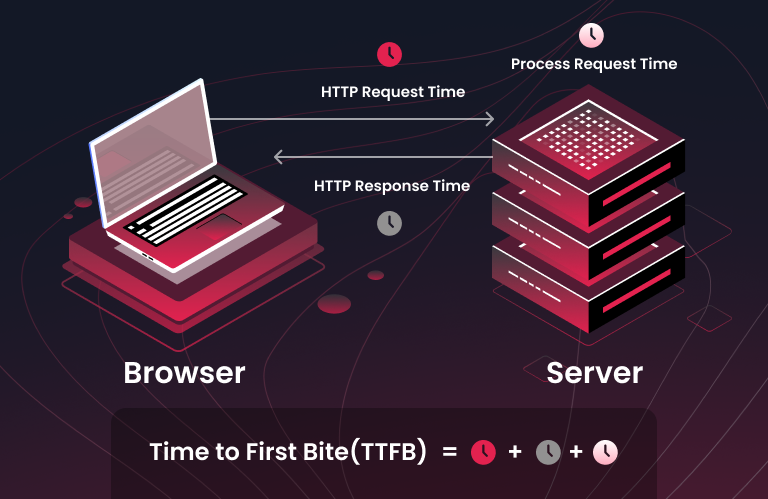
- DNS Lookup Speed: Tracks how fast the Domain Name Service translates a domain name into an IP address.
- Time to Interactive (TTI): Measures how quickly a user can begin interacting with the page.
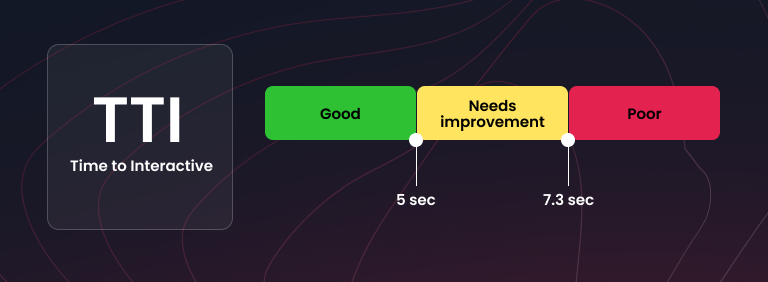
Monitoring these metrics helps identify performance bottlenecks and areas for improvement.
To understand how measuring these metrics can lead to actionable improvements, consider these examples:
- If a webpage has a slow Largest Contentful Paint (LCP), it indicates that the largest component is taking too long to load. The webpage owner should check if any unnecessary code is being loaded before this component and consider removing it.
- If a webpage experiences a slow Time to First Byte (TTFB), the site takes too long to extract resources from the initial server. The owner should look into the response times of their DNS provider and web host, considering reconfiguring or replacing one or both services to enhance performance.
How to improve website performance
Unfortunately, there is no one-size-fits-all solution to achieve strong web performance. That’s why website owners have to follow these best practices to enhance site speed and reliability.
Always optimise images
Images are often the slowest elements to load on a website due to their larger file sizes compared to CSS and HTML files.
Fortunately, image load times can be improved through image optimisation, which generally includes lowering the resolution and dimensions of the images, as well as compressing the image files themselves.
Limit the number of HTTP requests
Most web pages require multiple HTTP requests for various assets, such as images, scripts, and CSS files.
Every request requires a round trip to the server that hosts the resource, which adds to the total load time.
Minimise the number of assets each page needs to load to address these challenges. Conducting a speed test can help identify which HTTP requests are taking the longest, allowing for targeted optimisations.
Use browser HTTP caching
The browser cache serves as a temporary storage area where browsers keep copies of static files, allowing them to load previously visited web pages more quickly.
Developers can set up instructions for browsers to cache some aspects of a webpage that are unlikely to change frequently.
These caching instructions are included in the headers of HTTP responses from the hosting server.
This practice significantly reduces the amount of data the server needs to transfer to the browser, leading to shorter load times for users who visit specific pages frequently.
Remove render-blocking JavaScript
Webpages may contain unnecessary code that loads before essential content, affecting overall load times. This issue is especially common on larger websites where multiple owners contribute code and content independently.
Web page owners can use web performance tools (e.g. Pingdom, YSlow) to pinpoint unnecessary code on underperforming pages, allowing for targeted improvements.
Limit the use of external scripts
Any scripted webpage fragments loaded from external sources—such as commenting systems, lead-generation popups, call-to-action buttons, or CMS plugins—must load each time the page is accessed.
They can slow down the page or prevent it from loading entirely depending on the size of these scripts. This issue, known as “content jumping” or “layout shifting,” can annoy mobile users, who may have to scroll to view the entire webpage.
Limit redirect usage
A redirect is the process when website visitors are redirected to a different page instead. This process can add fractions to page load times of a few seconds.
While some redirects are required, they are often misused and stacked up over time, especially on larger websites with multiple contributors. Website owners should establish clear guidelines regarding the usage of redirects and regularly check core web pages for proper functioning.
Minify CSS and JavaScript files
Minifying code involves removing elements that are unnecessary for a computer to interpret and execute the code, such as whitespace, comments, and extra semicolons.
This process reduces the size of JavaScript and CSS files, allowing them to load more quickly in the browser and consume less bandwidth.
While the performance improvements from minification may be modest, they remain valuable best practices.
Overcome geographical location limitations
Geographical location can impact loading times more than you might think. While you can’t change the physical distance between your website visitors, you can improve loading speeds by using a Content Delivery Network.
A CDN is a group of servers distributed across the globe that accelerate the content delivery.
Popular CDNs include Rackspace, Amazon CloudFront, and Microsoft Azure. You can significantly reduce load times by storing your files closer to your audience.
Use effective third-party services for important website functions
Hosting:
Even the most well-designed website will suffer from slow loading times if its origin server has a slow response rate. Website owners should opt for a server that maintains an average response time of under 200 milliseconds and has a strong track record of reliability.
DNS:
DNS is a system that converts domain names (such as example.com) into IP addresses, playing a crucial role in page loading. Website owners should select DNS services that provide fast and reliable resolution rather than relying solely on the DNS offered by their web host.
Cybersecurity:
DDoS attacks, malicious bots, and other cyber threats can significantly impact a website’s performance. While this topic is too extensive, website owners should select a web application security provider that effectively filters out malicious traffic while ensuring that legitimate traffic remains unaffected.
Tools to improve web performance: website speed optimization tips
The tools listed below can assist in identifying website performance issues by suggesting improvements. However, it’s wise to remember that performance optimisation is an ongoing process that requires continuous website monitoring.
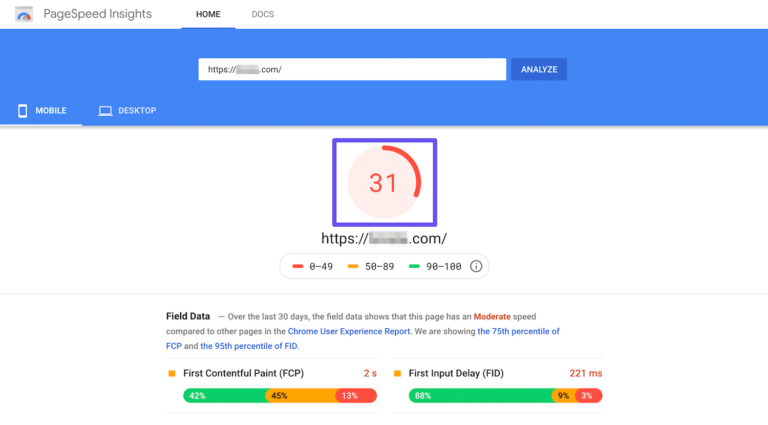
PageSpeed Insights is a free tool provided by Google that analyses a web page’s performance and provides suggestions for improvement. It evaluates both mobile and desktop versions of a site, offering insights into key performance metrics such as Largest Contentful Paint (LCP), First Input Delay (FID), and Cumulative Layout Shift (CLS)—the three Core Web Vitals essential for user experience.
GTmetrix
GTmetrix is a widely used web performance tool that helps website owners and developers analyse and optimise their sites’ speed and overall performance. By providing detailed reports on key performance indicators, GTmetrix allows users to identify bottlenecks and opportunities for improvement.
One of GTmetrix’s strengths is its ability to test websites from different locations worldwide, using various devices and connection speeds. This feature helps developers understand how their site performs in different real-world scenarios. It also offers a Waterfall Chart, which visually represents how different resources load over time, making it easier to spot delays or challenging assets like large images, slow scripts, or unoptimised fonts.

Pingdom
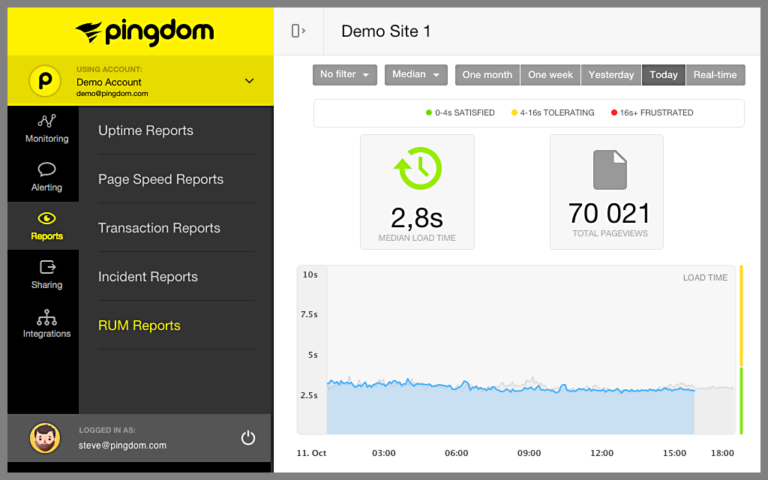
Pingdom is a popular website monitoring and performance testing tool that helps website owners, developers, and IT teams ensure their sites are running efficiently. Known for its user-friendly interface and detailed insights, Pingdom allows users to monitor website uptime, track response times, and analyse various aspects of performance, making it a valuable tool for maintaining an interactive online experience.
WebPageTest
WebPageTest is a powerful open-source tool designed for testing and analysing web page performance. It provides a complete suite of features that allow developers and website owners to evaluate how their sites perform under various conditions, offering insights into load times, rendering behaviour, and overall user experience.
WebPageTest offers a waterfall chart that visualises the loading sequence of each resource (images, scripts, stylesheets, etc.). This breakdown helps identify which elements are causing delays and how they affect overall page performance.
In addition, users can configure tests with different network speeds, latency, and connection types (e.g., 3G, 4G) to simulate various user conditions. This feature is important for understanding how performance might vary based on the user’s environment.

YSlow
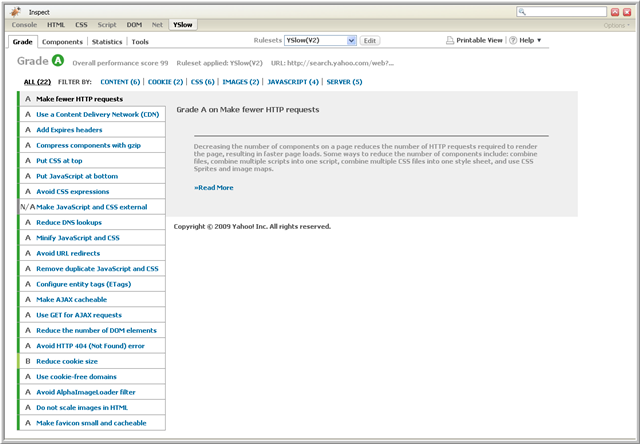
This browser extension analyses web pages and gives performance improvement suggestions based on Yahoo’s performance rules. It rates the page’s performance on a scale from A to F and offers recommendations for enhancements.
The final words
Optimising website speed and efficiency is key to delivering a better user experience and overall site performance. Remember, every small adjustment contributes to a better user experience and can lead to increased engagement and satisfaction. Take the time to regularly review and update your strategies, and you’ll ensure that your website remains responsive and effective in meeting your audience’s needs.
At Altamira, we know how to address your requirements and technology needs. Our team helps you transform your idea into a high-performing web-based solution—just as you envisioned.
Cooperating with us will give you
- Unique client-based approach
- Access to the vast talent pool
- Agile project management
- Total involvement of every specialist
- Minimised development risks
- Transparency and flexibility of every development step
- A project that meets your requirements and fits your budget
Book a call to get a free expert consultation regarding your project.


